title: "setView()"
output: html_document
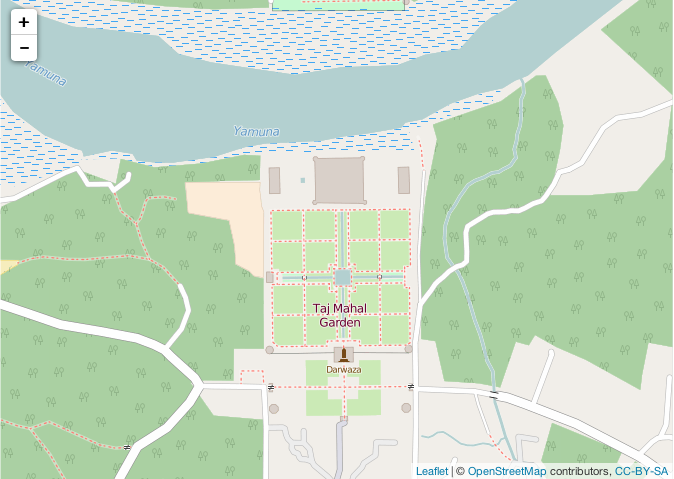
Load the leaflet package, create the map widget, add tiles and take a step further by setting the view centered at latitude and longitude of "Taj Mahal", India and also set a zoom.
setView() takes the input argument as latitude, longitude and zoom. The view is then centered to the latitude and longitude passed.
library(leaflet)
mymap = leaflet()
mymap = addTiles(mymap)
mymap = setView(mymap, lng = 78.042068,lat = 27.173891, zoom = 16)
mymap # print the map
Here is the example using pipe operator. The below code will produce the same results.
  mymap = leaflet() %>%
  addTiles() %>%
  setView(lng = 82.9739144,lat = 25.3176452, zoom = 16)

mymap